

The Minnesota Vikings and the New York Giants, with only one loss each after seven weeks of play, are in control of their seasons with a clear path to the playoffs. But the conversation surrounding both teams is skeptical. They play ugly, close games and win in the fourth quarter instead of the first.
Both quarterbacks have their fair share of skeptics, and the first-year head coaches manning the teams have a strong history of success with quarterbacks but aren’t finding ways to use that history to pull those teams ahead.
We know that teams that win early in the season aren’t guaranteed to win late in the season, and there’s a history of strong-starting teams falling off, with about one in five of those teams disappointing down the stretch.
But knowing that fact and figuring out which teams might fall off are two different things. Is there a way to identify which teams are playing “unsustainably” well, and do either the Giants or Vikings qualify?
Team-Level Statistics Paint a Picture
We can take a look at broad team-level statistics to see which teams are punching above their weight and which teams are playing down-to-down like winning teams often do. The most obvious is point differential – teams that win by a little and lose by a lot generally do not sustain winning.
The good news for both teams is that they rank pretty highly in point differential. The Giants rank eighth in point differential per game while the Vikings rank sixth. That’s not quite second and third — their respective rank in win percentage — but it’s not bad.
For perspective, the number of wins they would have based on “Pythagorean expectation,” a term invented by baseball statistician Bill James to estimate wins off of runs, would be 3.9 wins for the Vikings and 4.5 wins for the Giants, or 1.1 to 1.5 wins off their actual total. An overperformance by this metric but not worryingly substantial.
Then again, averages don’t always capture realities. Another way to look at this same problem from another angle is to look at records in close games. In six games, the Vikings have played in four one-score games. The Giants. meanwhile, have had all seven of their games fall in that range. Historically, it’s been a much better bet to project future success for a team by assuming they drew in close games and only take multiple-score wins and losses as determinative of quality.
In this case, both teams would be functionally .500. And if we wanted to eliminate the odd game here or there with garbage-time scores that arbitrarily increased or decreased the point differential without having a chance of impacting the outcome, we can use “game script” which looks at the average score over every single second of the game.
In that way, the Vikings are fairly far ahead of the Giants in this regard, even though the Vikings have found themselves in a number of scenarios where they’ve had to mount fourth-quarter comebacks.
| Team | Game Script Score | Implied Win Rate |
|---|---|---|
| Philadelphia Eagles | 7.57 | 0.823 |
| Buffalo Bills | 6.38 | 0.775 |
| Baltimore Ravens | 5.36 | 0.734 |
| Kansas City Chiefs | 3.90 | 0.676 |
| San Francisco 49ers | 3.54 | 0.661 |
| Jacksonville Jaguars | 3.38 | 0.655 |
| Tennessee Titans | 3.13 | 0.645 |
| Seattle Seahawks | 1.60 | 0.584 |
| Minnesota Vikings | 1.20 | 0.568 |
| Dallas Cowboys | 1.20 | 0.568 |
| Las Vegas Raiders | 1.01 | 0.560 |
| Cincinnati Bengals | 0.87 | 0.555 |
| New England Patriots | 0.83 | 0.553 |
| Green Bay Packers | 0.53 | 0.541 |
| Cleveland Browns | 0.41 | 0.536 |
| Los Angeles Rams | 0.00 | 0.520 |
| Carolina Panthers | -0.48 | 0.501 |
| Denver Broncos | -0.74 | 0.490 |
| Los Angeles Chargers | -0.85 | 0.486 |
| New York Jets | -1.31 | 0.468 |
| Miami Dolphins | -1.39 | 0.464 |
| Houston Texans | -1.46 | 0.461 |
| Chicago Bears | -1.69 | 0.453 |
| Tampa Bay Buccaneers | -1.77 | 0.449 |
| New York Giants | -1.94 | 0.442 |
| Detroit Lions | -1.96 | 0.442 |
| New Orleans Saints | -2.28 | 0.429 |
| Atlanta Falcons | -3.28 | 0.389 |
| Pittsburgh Steelers | -3.53 | 0.379 |
| Washington Commanders | -4.06 | 0.358 |
| Arizona Cardinals | -5.91 | 0.284 |
| Indianapolis Colts | -6.00 | 0.280 |
This is better than pure point differential and predicts future success with more accuracy, but points aren’t as play-to-play consistent. There are a few ways to measure this, but one of the most comprehensive is Football Outsiders’ DVOA, which is also more predictive than pure point total.
DVOA essentially combines per-play yardage (adjusted for down and distance) and success rate, with the knowledge that explosive plays and strings of success both matter in predicting football performance going forward. It also accounts for the strength of the opponent.
In this measure, the Giants rank 14th and the Vikings rank 18th, implying that they are more like .500 teams than .750 or .800 teams.
We can look at another measure that tries to identify consistency – Drive Success Rate. This measure attempts to figure out how often teams generate first downs given their opportunities to do so.
If a team gains possession at their own 25-yard line, they have one opportunity to gain a first down. If they convert a new series of downs, that means they’ve created another opportunity. If they don’t convert that series of downs, then they have a Drive Success Rate on that drive of .500. If they generate four first downs and then kick a field goal, that’s a Drive Success Rate of .800. And a touchdown ends it at 1.000.
This measure doesn’t punish teams for field position and still rewards big plays and touchdowns. In net drive success rate, the Vikings and Giants rank 21st and 22nd, worse than their measures in the other team-level metrics we looked at.
Player-Level Statistics Suggest Vikings More Likely To Regress
Not only can we look at how a team performs, but we can also check in on some of the most important individual players on a team to see if their level of play is commensurate with high-level players on winning teams and check to see whether or not that is a warning sign for future drop-off.
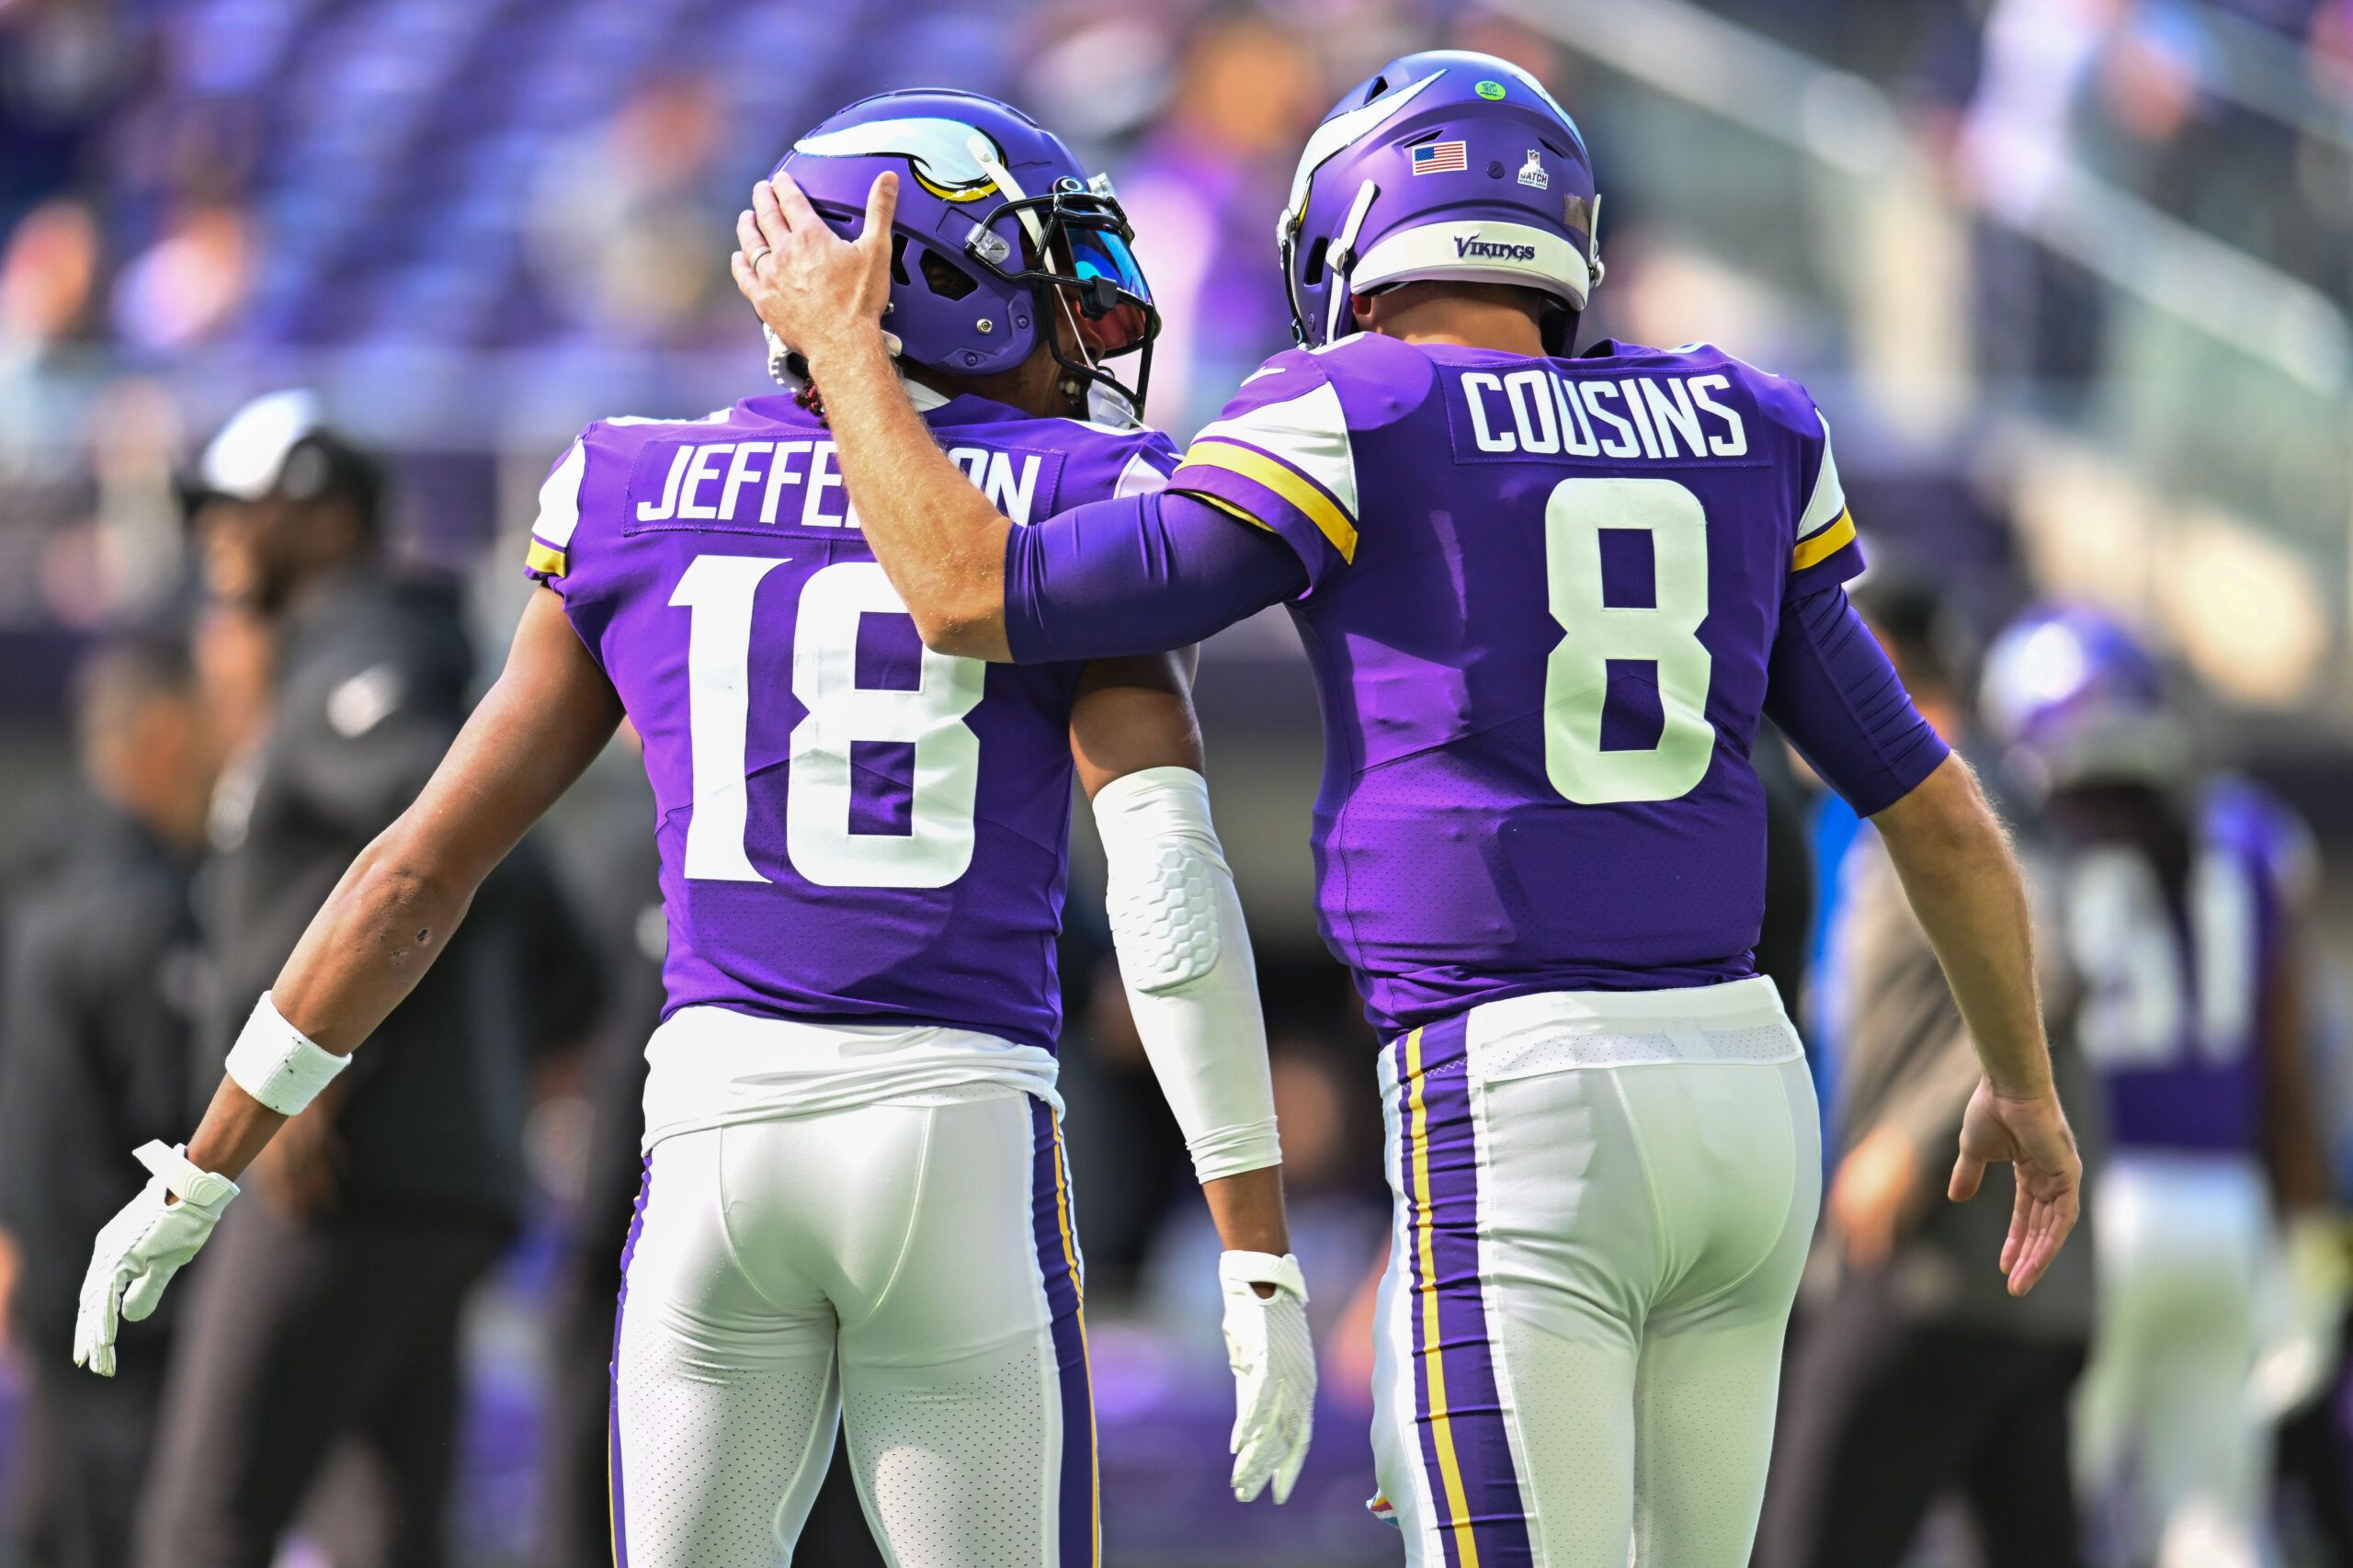
More than anything else, the quarterback matters. And for Daniel Jones and Kirk Cousins, there are different reasons to worry.
For Jones, he has a higher turnover-worthy play rate than big-time throw rate – measures that account for receiver drops and dropped interceptions from defensive backs. In particular, his interception rate doesn’t track with his turnover-worthy play rate, and this typically comes back to bite quarterbacks later in the season.
Both generate low yards-per-attempt and net yards per attempt, which are stable measures that project team performance going forward, though Jones does a much better job of generating completions above expectation given context like depth of target, distance of nearest defender, pressure, and so on.
MORE: In Week 7, Daniel Jones Does It Again
Jones seems more likely than Cousins to rebound from that. While Cousins has weapons that Jones does not, Jones’ recent uptick in play tells us there may be something to his improvement. Not only that, Jones is suffering from a receiver corps with a high drop rate, an outlier that typically regresses as the season continues.
Cousins can probably take heart in the fact that his receivers aren’t winning contested catches at the rate they’ll be expected to going forward, but the bulk of the in-season data tells us there’s a bit more reason for optimism for Jones than Cousins.
That probably matters less than career data, where Cousins is miles ahead of Jones. There’s just as much reason to believe that Jones’ good production was a blip as there is to believe that Cousins’ poor production is a hiccup.
There are enough non-data reasons, like Brian Daboll’s history with turning Josh Allen around, to talk oneself out of this problem with Jones.
On offense, there are no other key players who are playing surprisingly well or poorly in a way that should make one worry. Garrett Bradbury for the Vikings is having an outlier season, and there can be some concern that Saquon Barkley’s breakaway rate is perhaps higher now than it will be by the end of the season. But in either instance, the effect of regression is small.
Defensively, there are bigger concerns. The Vikings’ defense is not playing well, and there’s not much of a signal to indicate they will going forward. The best sign is that Danielle Hunter is a high-level player now playing below his career level of talent, but Za’Darius Smith is doing the opposite on the other side of the line – this could even out more than anything.
Not only that, the Vikings are likely the healthiest team in the league, having lost no starters to injury. Even with their investments in sports science, that sort of injury luck is unlikely to continue.
For the Giants, it seems more likely that their good defense will perform better rather than worse. While it’s worth wondering if Oshane Ximines can continue this pressure rate, what primarily sticks out is the low interception-to-pass deflection ratio. With 18 passes defensed but only one pick, regression is likely going to create more turnovers rather than less.
That has resulted in a higher scoring rate and lower turnover rate in the passing game than their overall play-to-play passing performance would suggest.
Altogether, this has produced a “net ANYA value” – a more precise passing measurement than passer rating – that looks bad for both teams.
ANY/A Value after the Week 7 slate. The Chicago Bears don't have the worst passing offense in the league (congrats, Pittsburgh!) pic.twitter.com/jxBtKgjI8m
— Justis Mosqueda (@JuMosq)
Again, this tells us that these teams should be closer to .500 than .800.
Red Flags
Still, we should evaluate turnovers in their totality. It’s one of a number of red flags that can signal that a team’s fortunes are about to turn. Takeaways have an outsized impact on the game, which is why fans always see it in the pregame “keys to the game” graphics put together by broadcast crews – teams that win the turnover battle win the game an overwhelming number of times.
But they are difficult to predict and hard to repeat. They often rely on an opposing offense making a mistake in a particular game or the defense falling on the ball after it bounced in an unexpected direction. There is some skill to creating turnovers, and good defenses will do so at a high rate, but it’s more often the case that teams with the highest turnover rate partway through the season won’t be able to replicate it down the stretch.
The same can be said on the other side of the ball, who often have more control over turnover production than defenses do but still are vulnerable to special teams errors or dropped passes turning into big plays for their opponents.
MORE: Week 7 NFL Rookie Report Card
On balance, the only team in the NFL that should be concerned about turnover margin bouncing back to hurt them is the Eagles, and they have more than enough leeway in other areas to be unconcerned about that. The Giants’ turnover margin is about average, and the Vikings’ turnover margin is a little high. They aren’t buoyed too much by fumble luck either, as the Giants are in the middle of the league in fumble recovery rate at 50 percent and the Vikings are slightly high at 64 percent.
The last red flag to be concerned about is unsustainable levels of special teams play. The Vikings, who have tested their luck with 50-plus-yard field goals without much success, nevertheless have one of the top special teams units in the league, ranking third in expected points generated on special teams. While their impressive kickoff coverage is unlikely to be a fluke, they’ve been generating a few turnovers in punt and kickoff coverage that they likely won’t be able to replicate going forward.
As is the case with all teams mired in ambiguity, it’s easy to make the case that one team or another will likely continue a high level of play. But most of the evidence tells us that these teams can’t keep up this level of play.
There’s more concern on that front with the Vikings than the Giants, given the defensive issues and special teams boosts altering their point totals. The Vikings, on a drive level and play-to-play level, are playing like a below-average team. And even if they see improvements from Cousins commensurate to his career play, they have too many issues on defense that it will be difficult to cover up for.
The good news for both teams is that they’re so far ahead of other NFC teams that even if they play the rest of the season as .500-level squads, they have enough wins in their back pocket to make the playoffs, with the Vikings going 10-5-1 in that scenario and the Giants going 11-6.
Neither team is likely to be sustainable in their level of performance, but that’s likely going to be a fun afterthought in January.